Trading Platforms Market Forecasting Technology
Trading Strategies Trading Platforms Trading Strategies Trading Algorithms Contact Us
Trading Technologies
Expert system with automatic inference of optimal strategy
Multiple trading strategies to balance profit and risk
Refined selection of technical indicators and algorithms
Trading Spotlight
High frequency algorithmic trading on your favorite trading platform


Algorithms


Built-in forecasting expert works on unique collection of elaborate predictors, technical indicators, digital filters and statistical tests to achieve top forecasting accuracy and reliability in full automated unattended mode. Not offered in any other product.


Trading strategies

  • Direct Forecast
  • Exact Price Change
  • Exact Forecast Threshold
  • Exact Forecast Change
  • Safe Exit
  • Safe Balance

Forecasting algorithms

  • ARIMA
  • Exponential Fit
  • Finite State Markov Automaton
  • History Prophet
  • Logarithmic Fit
  • Logistic Fit
  • MACD Crossover MA
  • Naive Predictor
  • Square Fit
  • Square Root Fit
  • Stepwise Best Regression MVAR
  • Univariate linear regression

Trading performance criteria

  • Asymmetry
  • Compare to Naive Predictor
  • Correlation Radius
  • Cumulative Gain
  • Excess
  • Fractal Dimension
  • Friedman
  • H parameter
  • Hurst Coefficient
  • K-Sample
  • Kruskal-Wallis
  • Net Profit
  • Normal Absolute Difference
  • Normal Root Mean Square
  • Predicted Change Direction
  • Scale of Sign Change Rate
  • Shannon Probability
  • Typical Run Length

Technical indicators

  • 1 day ROC of 3 Smooth EMA
  • Absolute Price Oscillator
  • Aroon Down
  • Aroon Oscillator
  • Aroon Up
  • Average Price
  • Average True Range
  • Avg Direct Move Idx Rating
  • Avg Directional Move Idx
  • BB Histogram
  • Balance of Power
  • Candle Code
  • Chaikin AD Line
  • Chaikin AD Oscillator
  • Commodity Channel Index
  • Directional Movement Index
  • Double Exponential MA
  • Exponential Moving Average
  • FXS Adaptive Moving Average
  • Hilbert Dominant Cycle Period
  • Hilbert Dominant Cycle Phase
  • Hilbert Phasor Components
  • Hilbert SineWave
  • Hilbert Transform Trendline
  • Hilbert Trend vs Cycle Mode
  • Kaufman Adaptive MA
  • Linear Regr Angle
  • Linear Regr Intercept
  • Linear Regr Slope
  • Linear Regression
  • MACD 12-24
  • MACD Crossover
  • MESA Adaptive Moving Average
  • Median Price
  • MidPoint over period
  • Midpoint Price over period
  • Minus Directional Indicator
  • Minus Directional Movement
  • Momentum
  • Money Flow Index
  • Moving Average
  • Moving Average Ribbon
  • On Balance Volume
  • Parabolic SAR
  • Percentage Price Oscillator
  • Plus Directional Indicator
  • Plus Directional Movement
  • Projection Oscillator
  • Rate of change
  • Rate of change Percentage
  • Rate of change ratio
  • Relative Strength Index
  • Simple Moving Average
  • TEMA Stochastic
  • Time Series Forecast
  • Triangular Moving Average
  • Triple EMA
  • Triple EMA T3
  • Triple Exponential MA
  • True Range
  • Typical Price
  • Weighted Close Price
  • Weighted Moving Average
  • Wilder Relative Strength Ind
  • Williams Percent R


Free open API enables unlimited system extensibility both in data access and additional forecasting technologies which then are native consumed in system kernel expert reasoning. SOAP, DCOM and C++ bindings give easy direct integration with virtually any enterprise infrastructure including Java, NET, Delphi, MS Office, online portals and interactive web services.


Formulas

Below we provide the full table of algorithms available in ForeStock. Algorithms are grouped according to their packages. Packages are separate modules in common algorithmic space and are licensed individually. You can watch names of packages in License Manager. Licensing any package implies all algorithms contained inside it.


Forecasting algorithm

Description

Type


ARIMA Expert


ARIMA with expert model fit

Seasonal Auto-Regressive Integrated Moving Average forecasting model with automatic expert inference on all model parameters.

Predictor

Finite State Markov Automation


Finite State Markov Automation

We dynamically construct Markov models that describe the characteristics of Market data flow. Such models are used to predict future market states.

Predictor

Finite Impulse Response NN


Finite impulse response neural network

The finite impulse response neural network is a neural network, where scalar weights are replaced with moving average filters. These filters compute a weighted average of past values presented to the network, as opposed to the feed-forward network, which only computes a weighted "average" of the current value. These networks are trained using a variation on the backpropagation algorithm.

Predictor

Advanced Regressions


Forecast with average value

Classical moving average with period 20

Predictor

Linear regression

Linear regression line

y = at + b

calculated over 20 last points

Predictor

Exponential Fit

Exponential regression curve

y = eat + b

calculated over 20 last points

Predictor

Logarithmic Fit

Logarithmic regression

y = log(at + b)

calculated over 20 last points

Predictor

Logistic Fit

Logistic regression

y = c / [1 + e-(at + b)]

calculated over 20 last points

Predictor

Square Fit

Parabolic regression

y = (at + b)2

calculated over 20 last points

Predictor

Square Root Fit

Square root regression

y = (at + b)1/2

calculated over 20 last points

Predictor

History Prophet

Emulates “ideal” predictor. Forecast is set to real next observed value, which ensures 100% forecasting accuracy on historical data. It is very useful to calibrate performance of trading strategies in “ideal” conditions. In no case, it should be used as predictor in real trading.

Predictor

Naive Predictor

Forecast with the previous price. Dummy forecast to evaluate performance of other algorithms.

Predictor


Stocks & Commodities

Unraveling the Mystery
of Stock Prices

Boris G. Zinchenko

Here’s a simple method you can apply to interpret financial charts. It uses classical statistics as well as a number of simple chart indicators, which may help you better understand classical charts from the viewpoint of random processes.

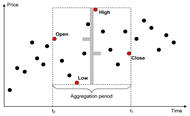
Every trader is familiar with stock charts. To most traders the chart is just a common tool, like a hammer is to the carpenter. The exception is the new trader reading charts for the first time or the advanced trader who begins to question the value of the charts he or she watches.

Although financial charts can be vivid and attractive, they do tend to have contradictions with modern statistics. The charts can introduce dubious and unstable measures, which in turn become the basis of popular trading strategies. This could increase the risk of your trading operations.

...read further in

Stocks & Commodities V. 28:3 (10-16)


Download 
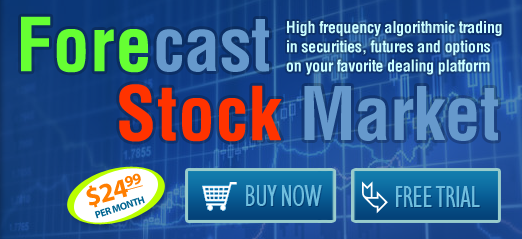
Download
Full featured free trial
User's guide User's guide
Step by step tutorial
User's guide Questions?
Find immediate answer!
 
Terms and conditions | Privacy policy | Disclosure statement | Useful links

Trading financial instruments, including foreign exchange on margin, carries a high level of risk and is not suitable for all investors. The high degree of leverage can work against you as well as for you. Before deciding to invest in financial instruments or foreign exchange you should carefully consider your investment objectives, level of experience, and risk appetite. The possibility exists that you could sustain a loss of some or all of your initial investment and therefore you should not invest money that you cannot afford to lose. You should be aware of all the risks associated with trading and seek advice from an independent financial advisor if you have any doubts. Please view the document titled Risk Disclosure Statement for Futures and Futures Options.

Buy Now Download