|
|
|
|
|
||
 |
 |
 |

Trading strategies StockFusion Studio 2.0 is the new generation of intelligent trading advisor based on unique Aura Forecast Engine (patents No 2003611241, 2003611242). Product is based on many years of studies in nonlinear stochastic dynamics and turbulence theory applications to the short term fluctuations of world markets performed in the Russian Academy of Science. It comprises the wide variety of market forecasting algorithms including seasonal ARIMA, Stepwise Best Regressions, Finite State Markov Automation offered as ready to use adaptive trading strategies with adjustable trading commission correction and threshold trade triggers. Automated expert system instantly selects the best strategy for every market symbol by using elaborate nonparametric statistics such as Friedman coefficient, Hurst coefficient, fractal dimension, K-Sample and Kruskal-Wallis tests, Shannon probability, asymmetry, excess, correlation radius and many others. Applied together these tools allow to achieve unique accuracy in sharp trade signals ensured with true recurrent back testing over the whole trading history of each symbol.
Stunning Vista style user interface offers unique charting abilities with over a hundredth of technical indicators available in multiple concurrent charting windows with arbitrary drill down scaling. Concise trading performance reports and trade history listings are ready exportable into MS Office format. Batch system scan offers one click automatic optimization of the whole user portfolio. Free open API enables unlimited system extensibility both in data access and additional forecasting technologies which then are natively consumed in system kernel expert reasoning. SOAP, DCOM and C++ bindings give easy direct integration with virtually any enterprise infrastructure including Java, NET, Delphi, MS Office, online portals and interactive web services.
|
Unraveling the Mystery
of Stock Prices
| Boris G. Zinchenko |
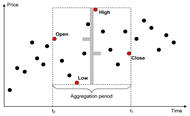
Here’s a simple method you can apply to interpret financial charts. It uses classical statistics as well as a number of simple chart indicators, which may help you better understand classical charts from the viewpoint of random processes.
Every trader is familiar with stock charts. To most traders the chart is just a common tool, like a hammer is to the carpenter. The exception is the new trader reading charts for the first time or the advanced trader who begins to question the value of the charts he or she watches.
Although financial charts can be vivid and attractive, they do tend to have contradictions with modern statistics. The charts can introduce dubious and unstable measures, which in turn become the basis of popular trading strategies. This could increase the risk of your trading operations.
...read further in
Stocks & Commodities V. 28:3 (10-16)
| Download Full featured free trial |
|
| User's guide Step by step tutorial |
|
| Questions? Find immediate answer! |
Trading financial instruments, including foreign exchange on margin, carries a high level of risk and is not suitable for all investors. The high degree of leverage can work against you as well as for you. Before deciding to invest in financial instruments or foreign exchange you should carefully consider your investment objectives, level of experience, and risk appetite. The possibility exists that you could sustain a loss of some or all of your initial investment and therefore you should not invest money that you cannot afford to lose. You should be aware of all the risks associated with trading and seek advice from an independent financial advisor if you have any doubts. Please view the document titled Risk Disclosure Statement for Futures and Futures Options.
